Primary
CPM
$9.47- Cost per 1K impressions
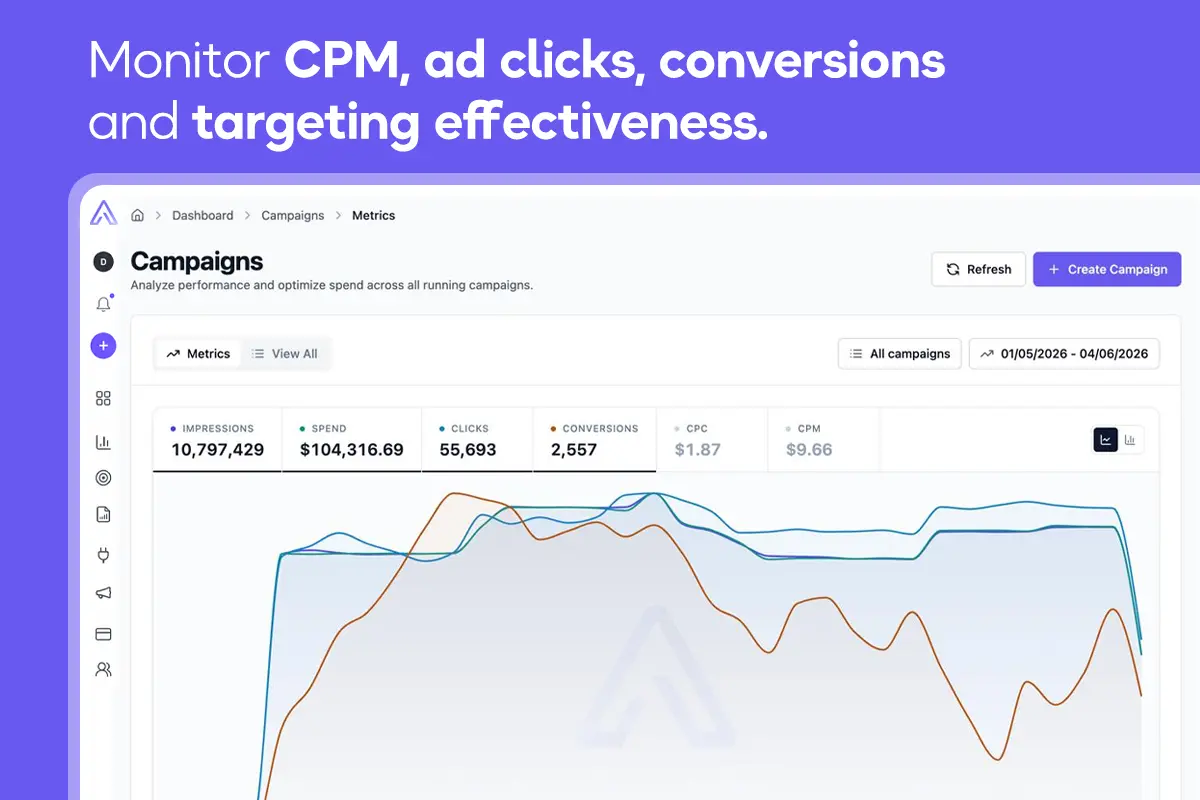
Campaign Analytics
Track average campaign performance metrics from the last 30 days. Monitor CPM, ad clicks, conversions, and targeting effectiveness across all verticals.
Geographic Data
Compare key metrics like impressions, clicks, and conversions across global regions in real time.
Country:
Impressions:
Clicks:
Conversions:
Audience Performance
Detailed metrics for iGaming
| Segment | Impressions | Clicks | Conversions | Conv. Value | AVG CPA |
|---|---|---|---|---|---|
|
29.1%
Sports Betting Enthusiasts
|
2.9M | 81.5K | 733 | $12.50 | $42.12 |
|
26.4%
Casino Game Players
|
2.6M | 68.6K | 549 | $11.83 | $42.46 |
|
18.7%
Poker Players
|
1.9M | 44.9K | 314 | $14.61 | $34.65 |
|
15.3%
Esports Bettors
|
1.5M | 35.2K | 282 | $12.40 | $27.96 |
|
10.5%
Live Casino Fans
|
1.1M | 22.1K | 154 | $8.14 | $47.02 |
Performance Metrics
Average metrics for iGaming
Primary
Primary
Industry Standards
Average performance for iGaming
Analytics & Insights
Compare key metrics like impressions, clicks, and conversions across global regions in real time.
Country:
Impressions:
Clicks:
Conversions:
Audience Performance
Detailed metrics for Blockchain & Crypto
| Segment | Impressions | Clicks | Conversions | Conv. Value | AVG CPA |
|---|---|---|---|---|---|
|
26.8%
ETH Holders
|
2.7M | 75.0K | 3.2K | $41.79 | $16.69 |
|
23.5%
BTC Traders
|
2.4M | 61.1K | 2.3K | $60.23 | $24.61 |
|
19.2%
DeFi Users
|
1.9M | 46.1K | 1.6K | $63.03 | $21.11 |
|
17.9%
NFT Collectors
|
1.8M | 39.4K | 1.3K | $52.93 | $19.57 |
|
12.6%
Altcoin Investors
|
1.3M | 25.2K | 731 | $28.87 | $22.74 |
Performance Metrics
Average metrics for Blockchain & Crypto
Primary
Primary
Industry Standards
Average performance for Blockchain & Crypto
Analytics & Insights
Compare key metrics like impressions, clicks, and conversions across global regions in real time.
Country:
Impressions:
Clicks:
Conversions:
Audience Performance
Detailed metrics for Gaming
| Segment | Impressions | Clicks | Conversions | Conv. Value | AVG CPA |
|---|---|---|---|---|---|
|
28.3%
Casual Mobile Gamers
|
2.8M | 67.9K | 25.8K | $10.69 | $30.54 |
|
24.1%
Strategy Game Players
|
2.4M | 53.0K | 17.2K | $10.28 | $47.39 |
|
19.7%
Puzzle Enthusiasts
|
2.0M | 39.4K | 14.1K | $9.76 | $34.73 |
|
16.5%
RPG Fans
|
1.7M | 31.4K | 8.8K | $11.24 | $42.89 |
|
11.4%
Competitive Gamers
|
1.1M | 20.5K | 5.1K | $10.86 | $24.96 |
Performance Metrics
Average metrics for Gaming
Primary
Primary
Industry Standards
Average performance for Gaming
Analytics & Insights
Compare key metrics like impressions, clicks, and conversions across global regions in real time.
Country:
Impressions:
Clicks:
Conversions:
Audience Performance
Detailed metrics for Finance & Fintech
| Segment | Impressions | Clicks | Conversions | Conv. Value | AVG CPA |
|---|---|---|---|---|---|
|
24.5%
High Net Worth Individuals
|
2.5M | 51.5K | 1.6K | 1.6K | $39.07 |
|
21.8%
Small Business Owners
|
2.2M | 41.4K | 1.2K | $67.37 | $24.30 |
|
19.3%
Investment Seekers
|
1.9M | 34.7K | 869 | $109.50 | $28.76 |
|
18.2%
Digital Banking Users
|
1.8M | 36.4K | 874 | $47.17 | $20.47 |
|
16.2%
Credit Builders
|
1.6M | 27.5K | 551 | $96.51 | $27.59 |
Performance Metrics
Average metrics for Finance & Fintech
Primary
Primary
Industry Standards
Average performance for Finance & Fintech
Analytics & Insights
Compare key metrics like impressions, clicks, and conversions across global regions in real time.
Country:
Impressions:
Clicks:
Conversions:
Audience Performance
Detailed metrics for SaaS & Tech
| Segment | Impressions | Clicks | Conversions | Conv. Value | AVG CPA |
|---|---|---|---|---|---|
|
27.3%
Software Engineers
|
2.7M | 71.0K | 284 | $241.38 | $26.91 |
|
24.8%
IT Managers
|
2.5M | 62.0K | 217 | $253.93 | $38.25 |
|
19.5%
Product Managers
|
2.0M | 46.8K | 150 | $207.51 | $26.38 |
|
17.2%
CTOs & Tech Leaders
|
1.7M | 37.8K | 144 | $166.10 | $25.87 |
|
11.2%
DevOps Teams
|
1.1M | 22.4K | 63 | $113.74 | $25.51 |
Performance Metrics
Average metrics for SaaS & Tech
Primary
Primary
Industry Standards
Average performance for SaaS & Tech
Analytics & Insights
Compare key metrics like impressions, clicks, and conversions across global regions in real time.
Country:
Impressions:
Clicks:
Conversions:
Audience Performance
Detailed metrics for AI & Emerging Tech
| Segment | Impressions | Clicks | Conversions | Conv. Value | AVG CPA |
|---|---|---|---|---|---|
|
28.7%
Data Scientists
|
2.9M | 57.4K | 431 | $113.58 | $32.93 |
|
25.4%
ML Engineers
|
2.5M | 48.3K | 338 | $109.61 | $31.87 |
|
18.9%
AI Researchers
|
1.9M | 34.0K | 231 | $155.26 | $37.28 |
|
16.1%
Tech Innovators
|
1.6M | 27.4K | 178 | $157.15 | $35.29 |
|
10.9%
Enterprise AI Leads
|
1.1M | 17.4K | 126 | $156.97 | $33.34 |
Performance Metrics
Average metrics for AI & Emerging Tech
Primary
Primary
Industry Standards
Average performance for AI & Emerging Tech
Analytics & Insights
Compare key metrics like impressions, clicks, and conversions across global regions in real time.
Country:
Impressions:
Clicks:
Conversions:
Audience Performance
Detailed metrics for Regulated Industries
| Segment | Impressions | Clicks | Conversions | Conv. Value | AVG CPA |
|---|---|---|---|---|---|
|
31.2%
Healthcare Professionals
|
3.1M | 81.1K | 1.7K | $64.73 | $39.98 |
|
27.8%
Legal Practitioners
|
2.8M | 69.5K | 2.2K | $118.92 | $15.57 |
|
18.4%
Pharma Decision Makers
|
1.8M | 44.2K | 839 | $101.44 | $38.56 |
|
13.9%
Hospital Administrators
|
1.4M | 30.6K | 550 | $107.48 | $26.68 |
|
8.7%
Medical Device Buyers
|
870.0K | 17.4K | 278 | $70.31 | $34.95 |
Performance Metrics
Average metrics for Regulated Industries
Industry Standards
Average performance for Regulated Industries
Frequently Asked Questions
All major IAB standard sizes: 300×250 (Medium Rectangle), 728×90 (Leaderboard), 160×600 (Wide Skyscraper), 320×50 (Mobile Banner), and 970×250 (Billboard). Served dynamically across desktop, tablet, and mobile placements.
There's no fixed minimum. Our platform works for test campaigns and large-scale media buys alike. Tell us your goal and we'll recommend a budget that makes sense - not one that just meets a threshold.
The minimum initial deposit is $5,000. Our platform supports both test campaigns and large-scale media buys. Tell us about your goals, and we'll recommend a budget that aligns with your campaign objectives.
CPM for awareness and reach. CPC for direct response and conversions. If you're not sure, our team will recommend the right model based on your campaign goal - not the one with the highest margin for us.
Ready to buy crypto traffic that actually converts? Three options for tracking: Pixel (a lightweight tag on your conversion page), Server-to-Server (S2S) for cookieless, privacy-compliant tracking, or Google Tag Manager for no-code setup. All three feed real-time data directly into your campaign dashboard.
Most campaigns are live within 24 hours of account approval and creative submission. Onboarding takes about five minutes. After that, it's just a matter of creative review - which we turn around fast.
Geo, device, interest, behaviour, and contextual targeting as standard. For Web3 campaigns, we also offer on-chain audience targeting - reaching users based on wallet activity and blockchain behaviour. No other network goes this deep.
Limited-Time Offer
Available for all new verified advertisers who deposit by August 1. Launch your campaigns faster with extra ad spend, premium traffic, and dedicated support.


